Village · Guadalajara · 1,170 m
Torrubia
Torrubia is a village at around 1,170 metres in the Campo de Molina, between Pardos, Tartanedo, and Cillas. In the mid-19th century it had 311 residents; today a few dozen. It connects the Pardos mines with Tartanedo's Romanesque art.
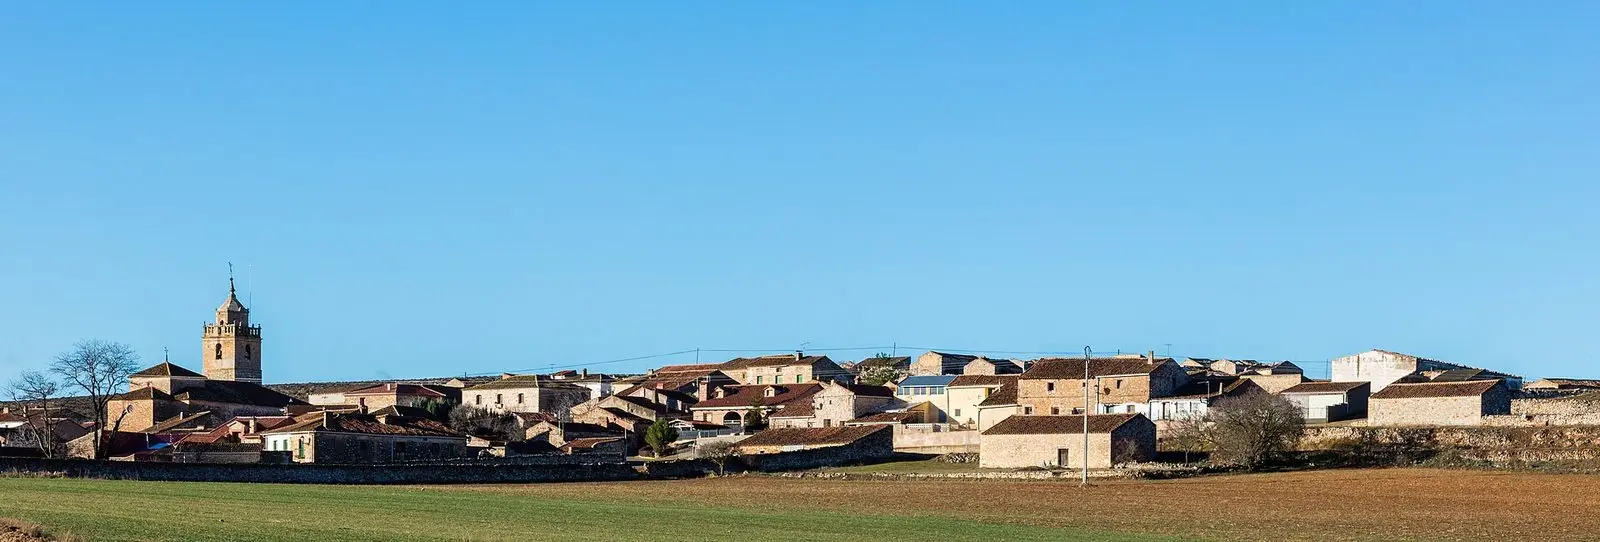
In the Campo
Torrubia sits at around 1,170 metres, on the cereal plains of the historic Sexma del Campo of Molina. Madoz counted around 311 inhabitants in the mid-19th century, and the village maintained close to three hundred until 1950. Today a few dozen people live here.
Nearby
- Pardos, three kilometres away, with the copper mines of La Estrella.
- Tartanedo, with the church of San Bartolomé and the Casa de los Utrera.
- Cillas and its sanctuary, where the Sexma del Campo historically assembled.
Near Torrubia
Casa de los Utrera: the Baroque palace of Tartanedo
Tartanedo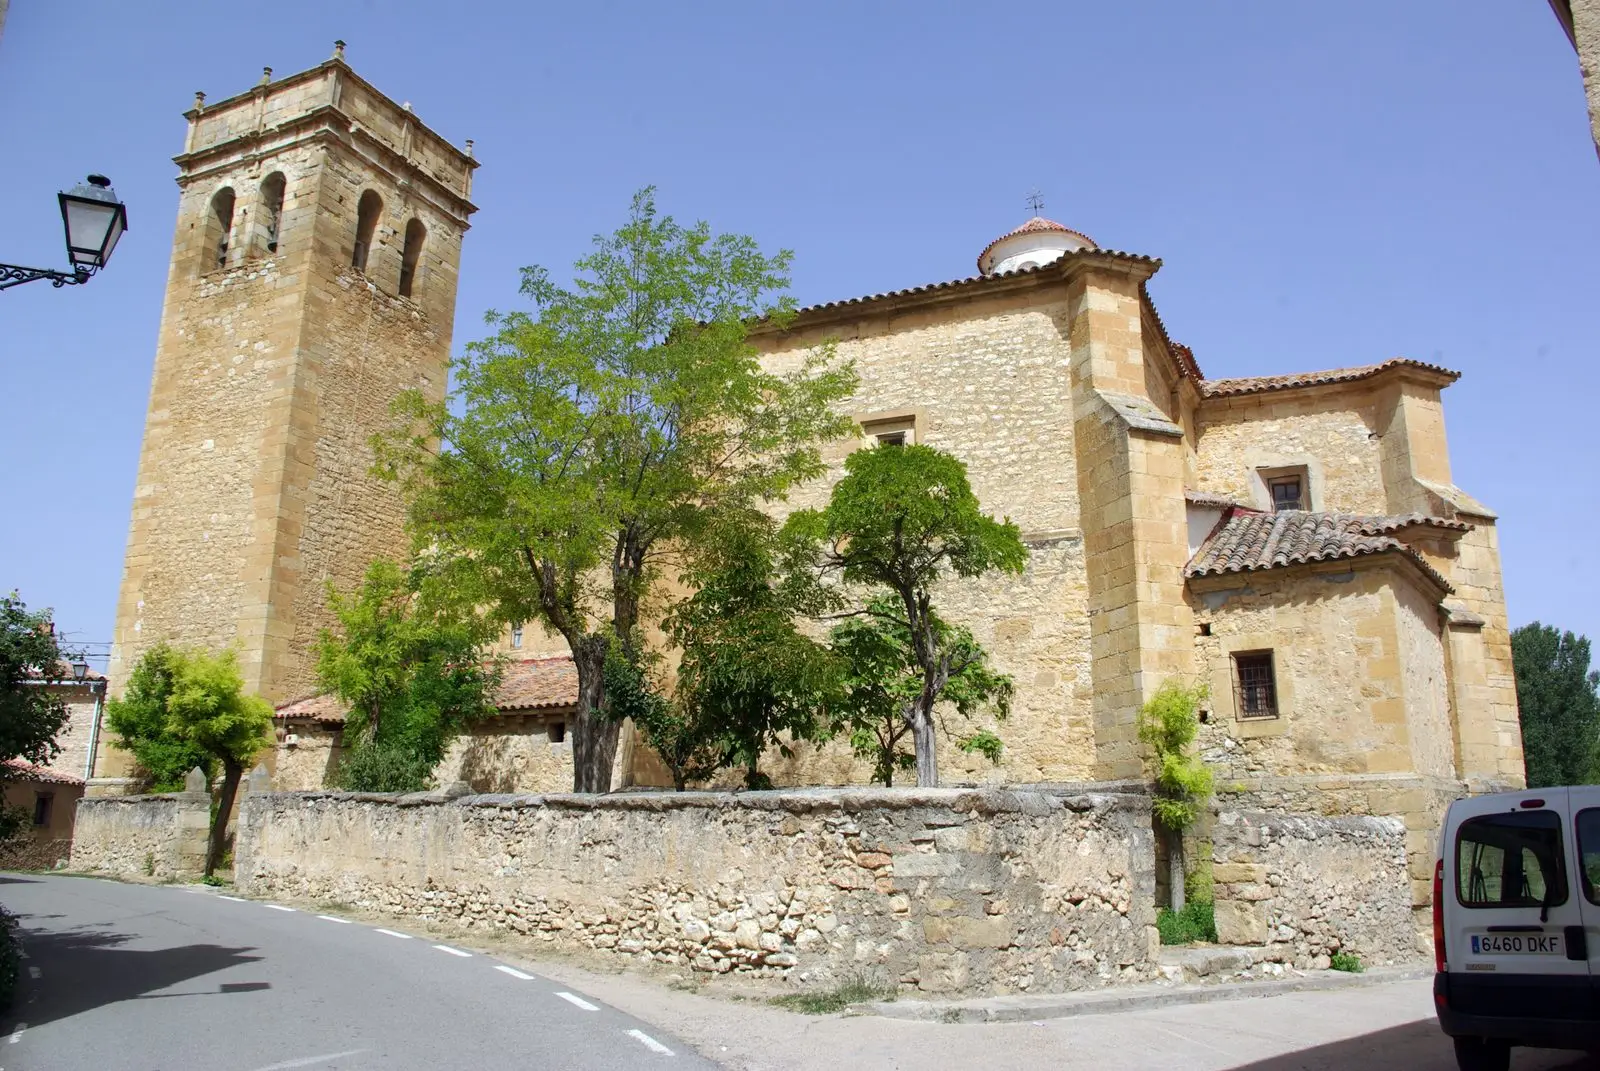
Church of San Bartolomé (Tartanedo): Romanesque portal with carved beasts
TartanedoSanctuary of La Concepción in Cillas, Meeting Place of the Sexma del Campo
CillasPardos mines: Mina Estrella and its copper minerals
Pardos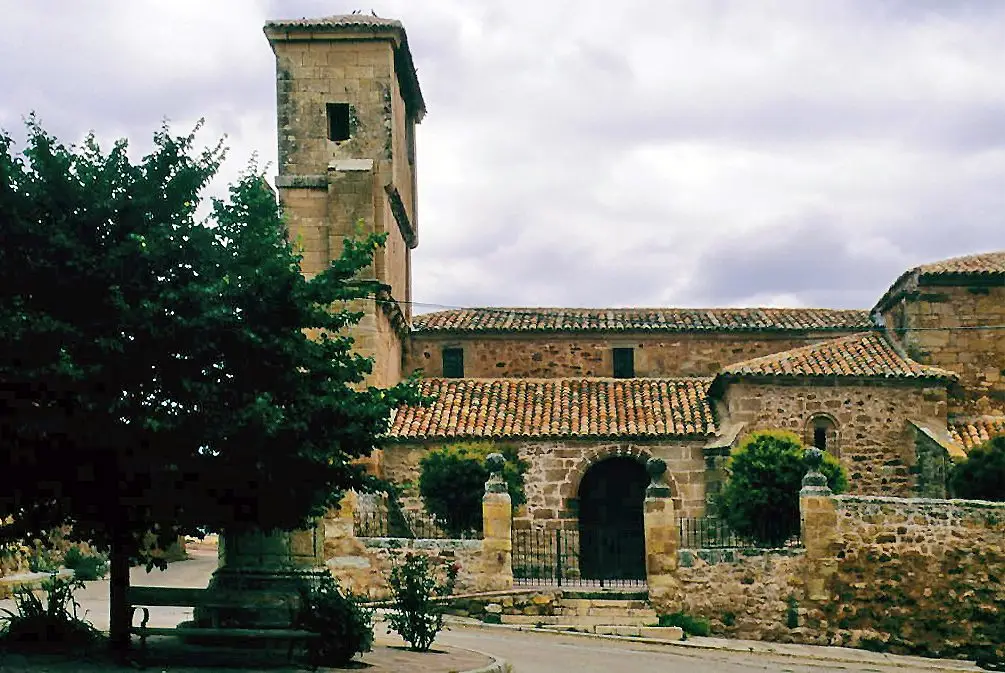
Church of Nuestra Señora de las Nieves (Rueda de la Sierra)
Rueda de la Sierra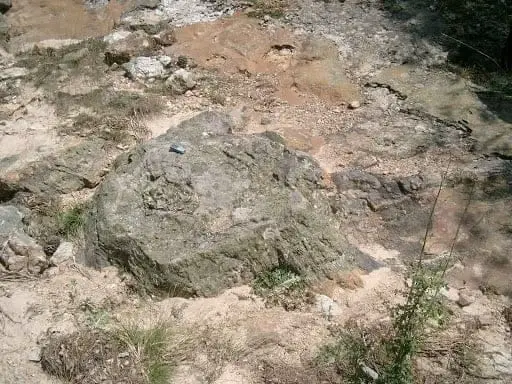
Fossil forest of Rillo de Gallo: a 300-million-year-old Pompeii
Aragoncillo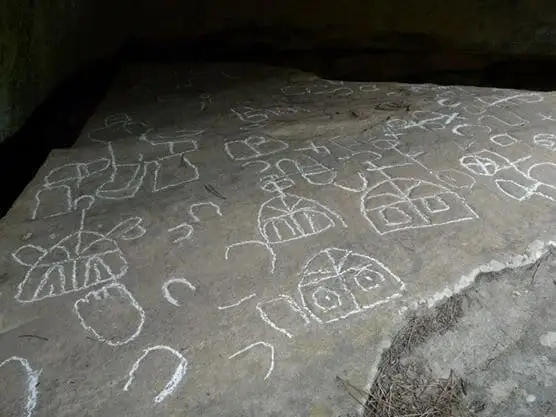
Peña Escrita (Canales de Molina): rock engravings with human figures
Canales de Molina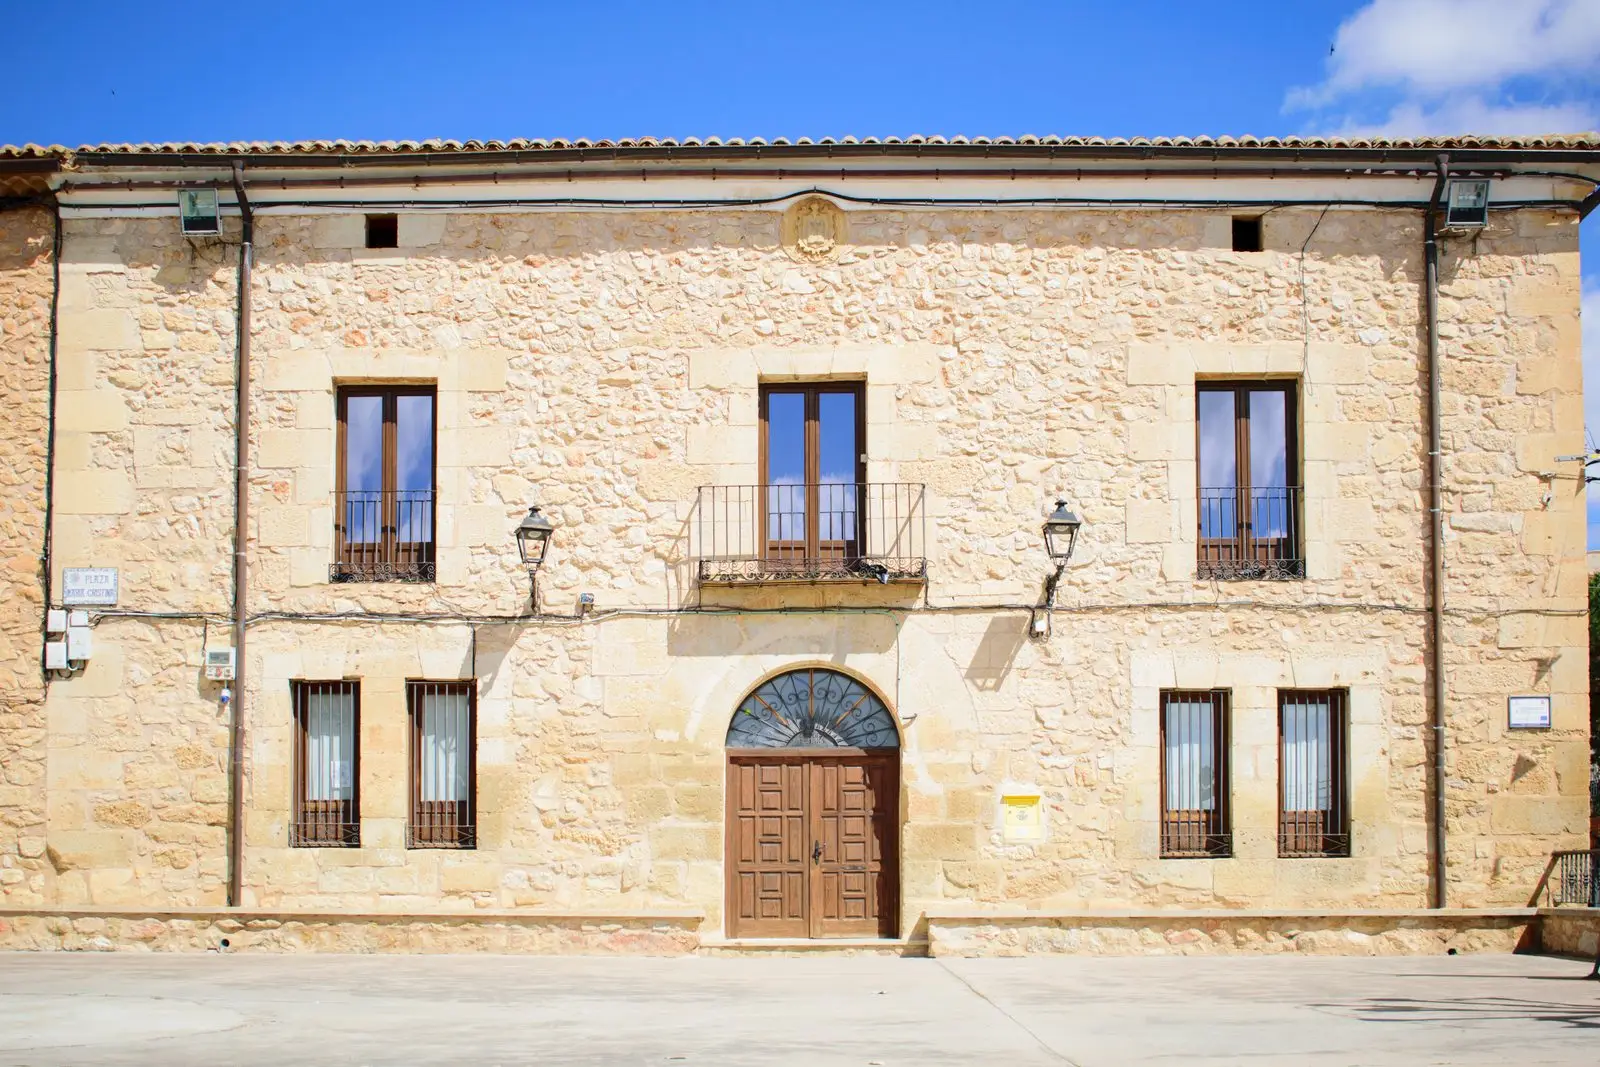
Molina-style manor houses of Tortuera
TortueraPopulation of Torrubia, 1842–2021
Torrubia reached a peak of 400 inhabitants in 1877 . In the 2021 census there were 22 , a decrease of 95%. This is the history told in the emptying of the Alto Tajo.
Climate in Torrubia month by month
2015–2024 averages from Copernicus ERA5 reanalysis for an altitude of approx. 1,170 m. Useful for planning, not a substitute for live forecasts.
Location
● Reference point · ● Villages · ● Places
Location diagram. Detailed map with tracks and names loads on zoom.
Reference villages: Pardos · Tartanedo · Cillas · Rueda de la Sierra.
Open the full map and historical layers →