Village · Guadalajara · 1,119 m
Tortuera
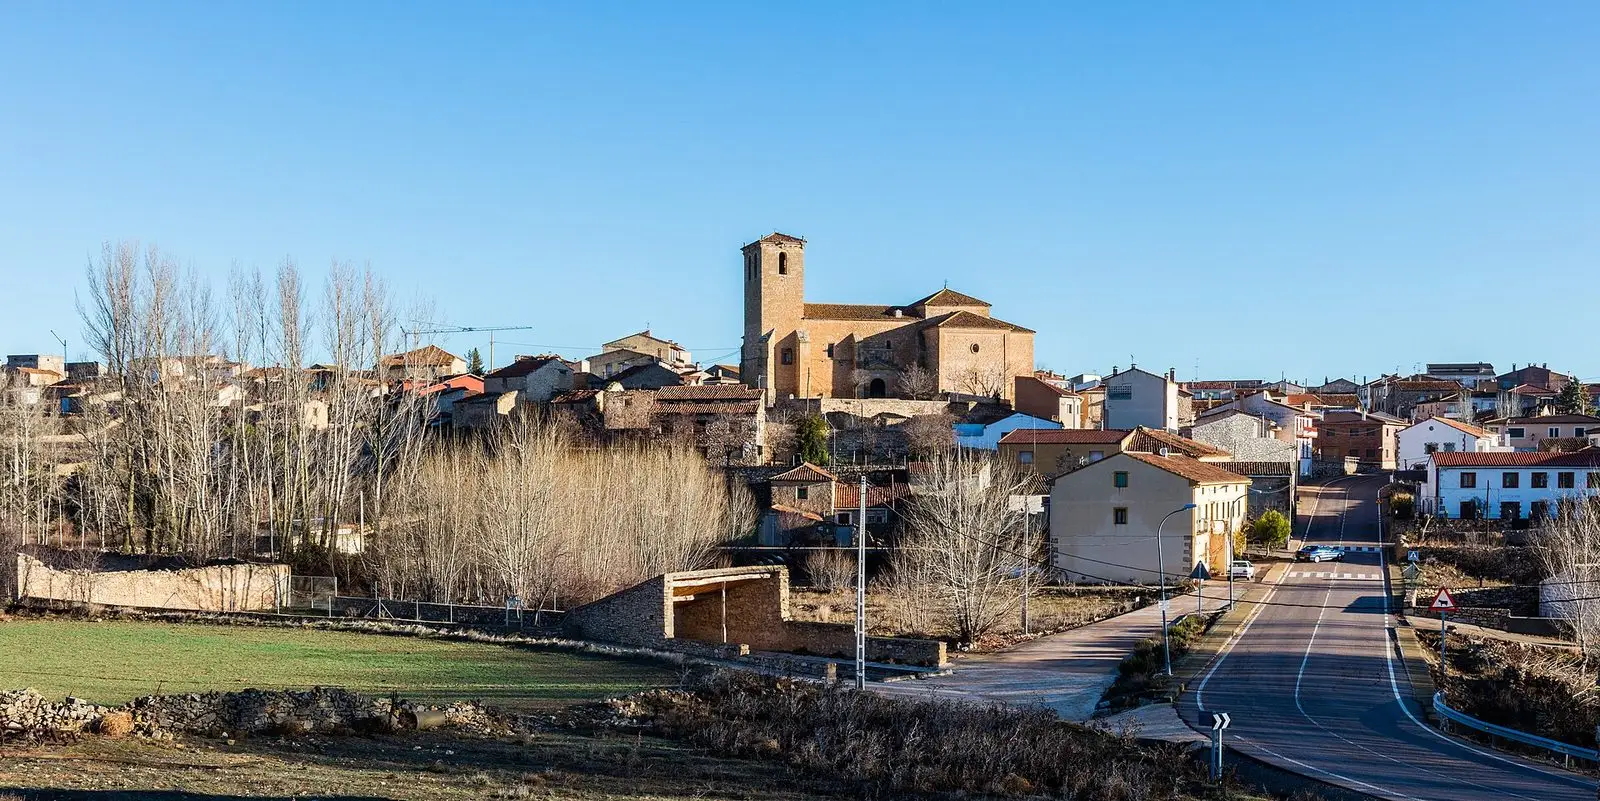
Tortuera is a lively village in the Campo de Molina at 1,120 metres in the Ebro basin. It preserves molinesa manor houses around Plaza Mayor and a wetland route visiting seasonal lagoons protected within the Natura 2000 network.
Lands and landscapes
From here, follow the memory of the territory
These readings connect Tortuera with the history, work, and villages around it.
Traces in the village and its surroundings
Which eras you can read here
A single place can preserve traces from different eras. These layers connect what you see with the stories in the atlas.
What to see in Tortuera
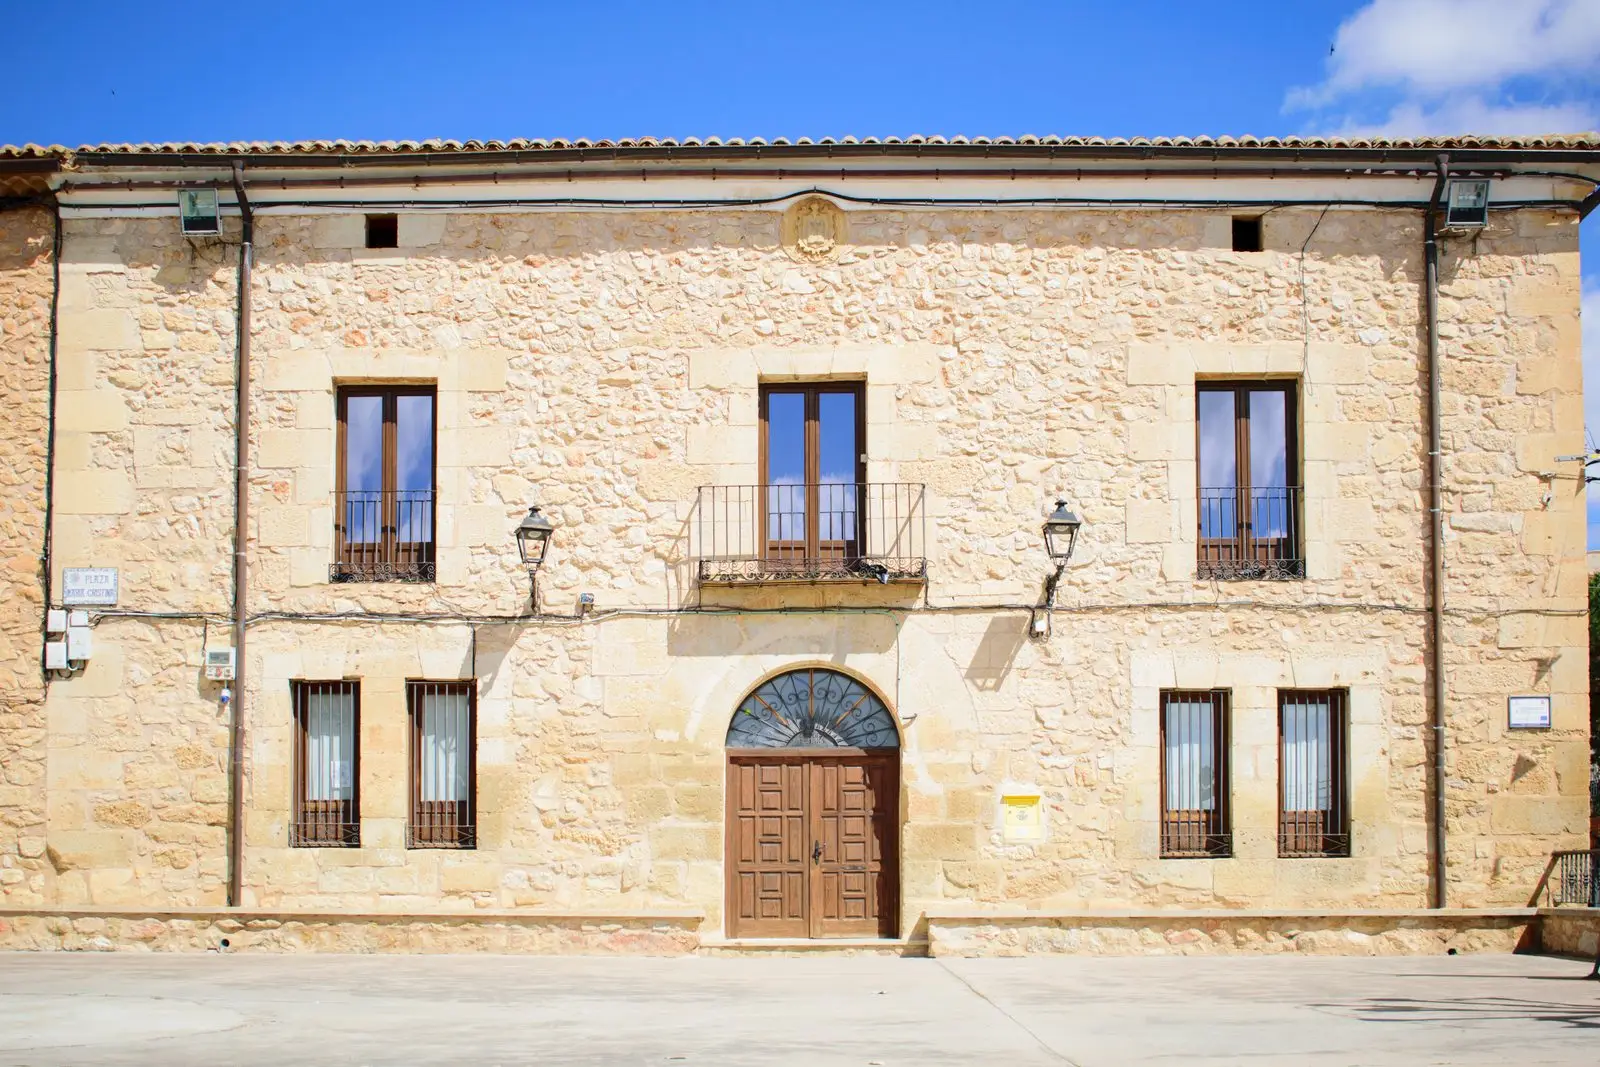
- The manor houses of Tortuera, with ashlar voussoir archways, coats of arms, and ironwork.
- The lagoons of Tortuera, seasonal wetlands hosting Dupont’s lark and migrating cranes.
A paramera of the Ebro
Tortuera stands at around 1,120 metres, on level terrain that barely exceeds a 10% slope. The climate is semi-arid, with under 500 mm of annual rainfall and thermal swings of nearly 20 degrees, which is why Mediterranean scrub with holm oaks, kermes oaks, and scattered junipers predominates. Its waters flow not towards the Tagus, but towards the Ebro: it forms part of the headwaters of the Piedra River.
History
Archaeological surveys indicate human occupation dating from the Late Bronze Age, at sites such as La Cañada. In the Señorío de Molina it belonged to the Sexma del Campo. In 1900 it had nearly seven hundred inhabitants and today it exceeds one hundred and fifty, making it one of the most resilient villages in the area.
Nearby
Cillas, Embid, and Rueda de la Sierra.
More to see
In the municipal area: the protected space Lagunas y parameras del Señorío.
Places in and around Tortuera
Routes linked to Tortuera
Near Tortuera
Sanctuary of La Concepción in Cillas, Meeting Place of the Sexma del Campo
Cillas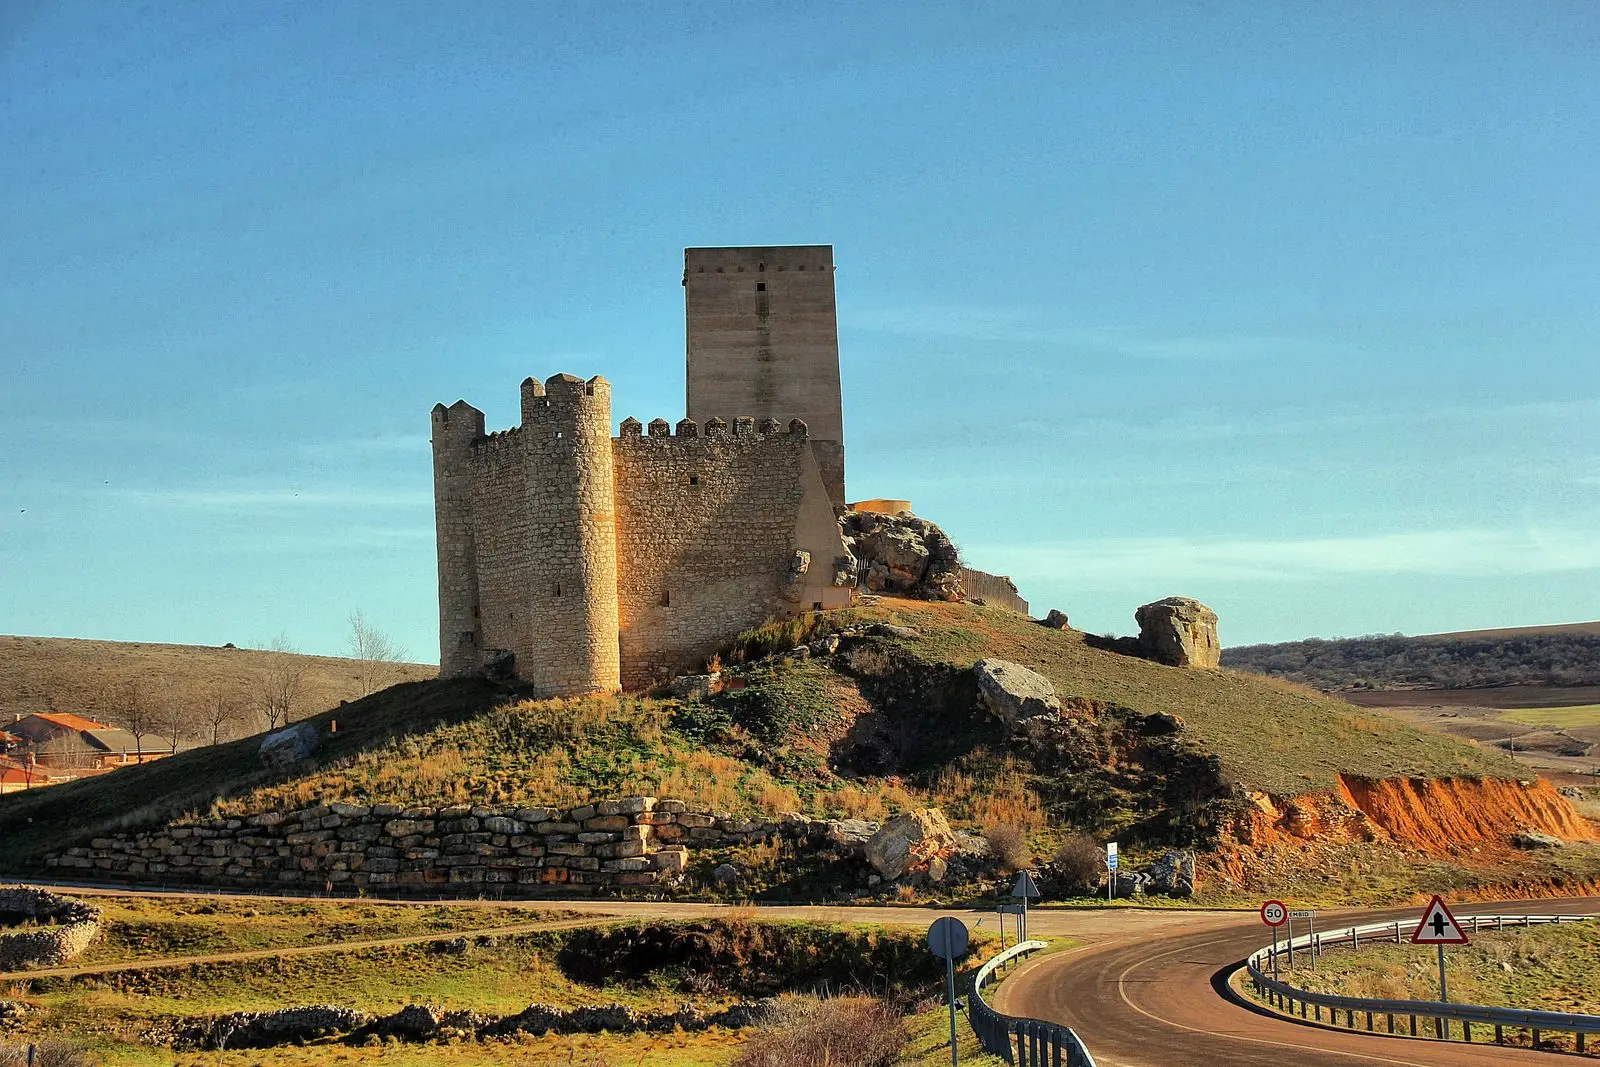
Castle of Embid: the pentagonal stronghold of the Aragon frontier
Embid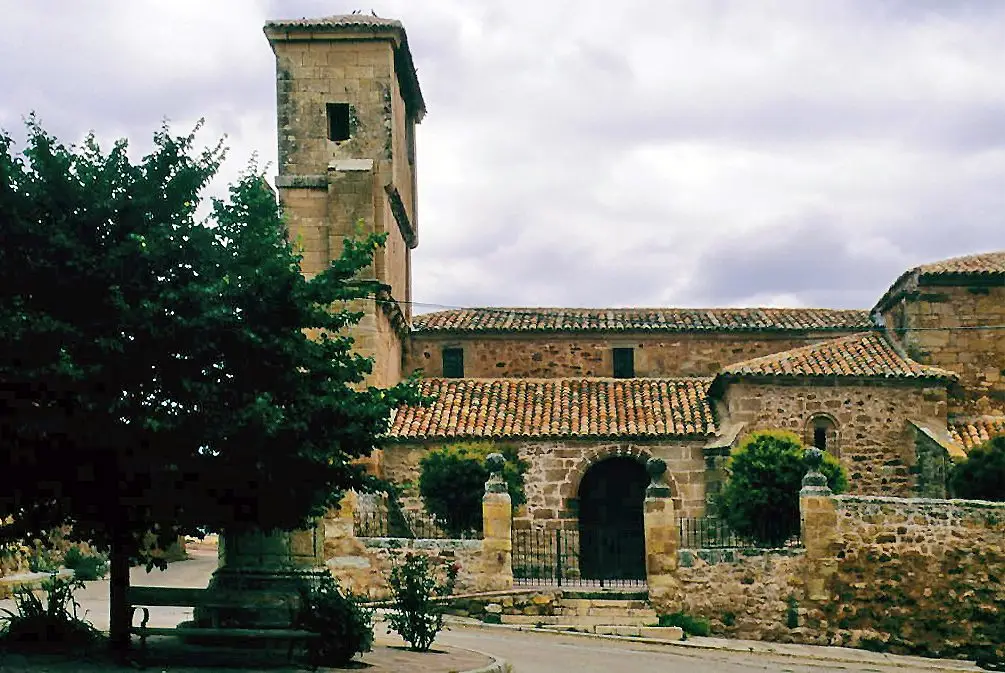
Church of Nuestra Señora de las Nieves (Rueda de la Sierra)
Rueda de la SierraLos Rodiles (Cubillejo de la Sierra): an oppidum facing Rome
Cubillejo de la SierraPairón de San Juan Bautista (Cubillejo del Sitio)
Cubillejo del SitioPonce de León Tower (Cubillejo de la Sierra) and its Museum
Cubillejo de la SierraCasa de los Utrera: the Baroque palace of Tartanedo
Tartanedo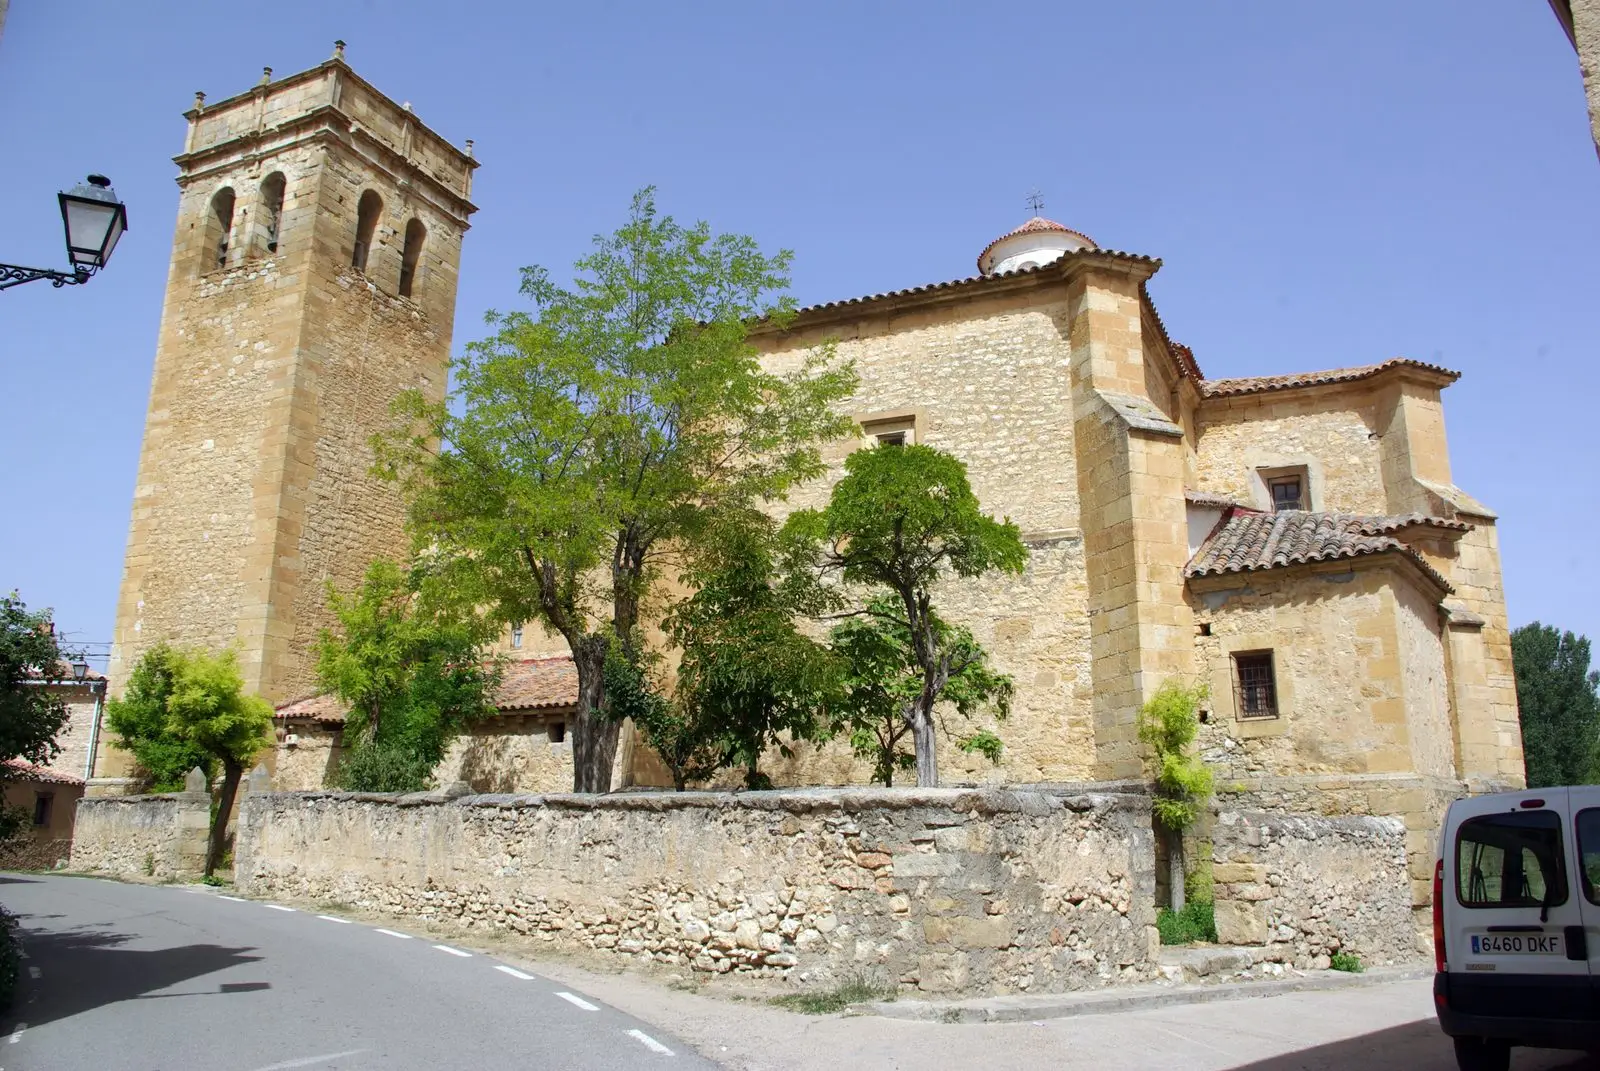
Church of San Bartolomé (Tartanedo): Romanesque portal with carved beasts
TartanedoPopulation of Tortuera, 1842–2021
Tortuera reached a peak of 790 inhabitants in 1950 . In the 2021 census there were 187 , a decrease of 76%. This is the history told in the emptying of the Alto Tajo.
Climate in Tortuera month by month
2015–2024 averages from Copernicus ERA5 reanalysis for an altitude of approx. 1,119 m. Useful for planning, not a substitute for live forecasts.
Location
● Reference point · ● Villages · ● Places
Location diagram. Detailed map with tracks and names loads on zoom.
Reference villages: Cillas · Embid · Cubillejo del Sitio · Rueda de la Sierra.
Open the full map and historical layers →