Village · Guadalajara · 1,056 m
Milmarcos
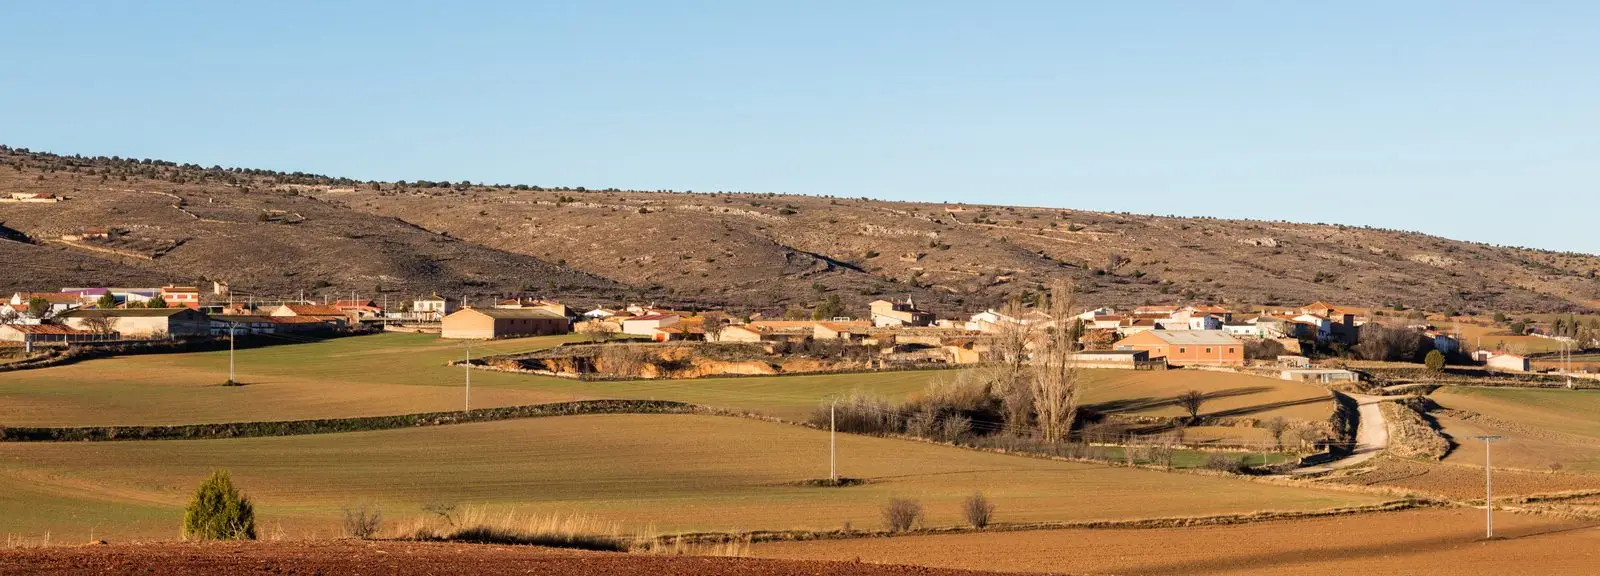
Milmarcos, at 1,060 metres in northeastern Guadalajara near Zaragoza, marked the border of Calatayud and joined the Señorío with Manrique de Lara. Preserves 18th- and 19th-century mansions, Renaissance San Juan Bautista church, and Zorrilla Theatre.
Lands and landscapes
From here, follow the memory of the territory
These readings connect Milmarcos with the history, work, and villages around it.
Traces in the village and its surroundings
Which eras you can read here
A single place can preserve traces from different eras. These layers connect what you see with the stories in the atlas.
What to see in Milmarcos
- The historic ensemble of Milmarcos: manor houses, the palace of López Montenegro, and the Zorrilla Theatre.
- The church of San Juan Bautista, Renaissance, with a Mannerist altarpiece.
A border town
Its name has Latin roots. Following the conquest of the Ebro and Jalón valleys by Alfonso I the Battler in the early 12th century, Milmarcos marked the boundary of the Calatayud village community. Shortly afterward, when Molina was granted to Manrique de Lara in 1129, it joined the Señorío, and in the early modern period gained the title of villa (chartered town). In the early 20th century it was a significant livestock and commercial centre; in 1900 it had nearly 900 inhabitants.
Nearby
Fuentelsaz, four kilometres away; Hinojosa, with Santa Catalina; and Labros.
Places in and around Milmarcos
Routes linked to Milmarcos
Near Milmarcos
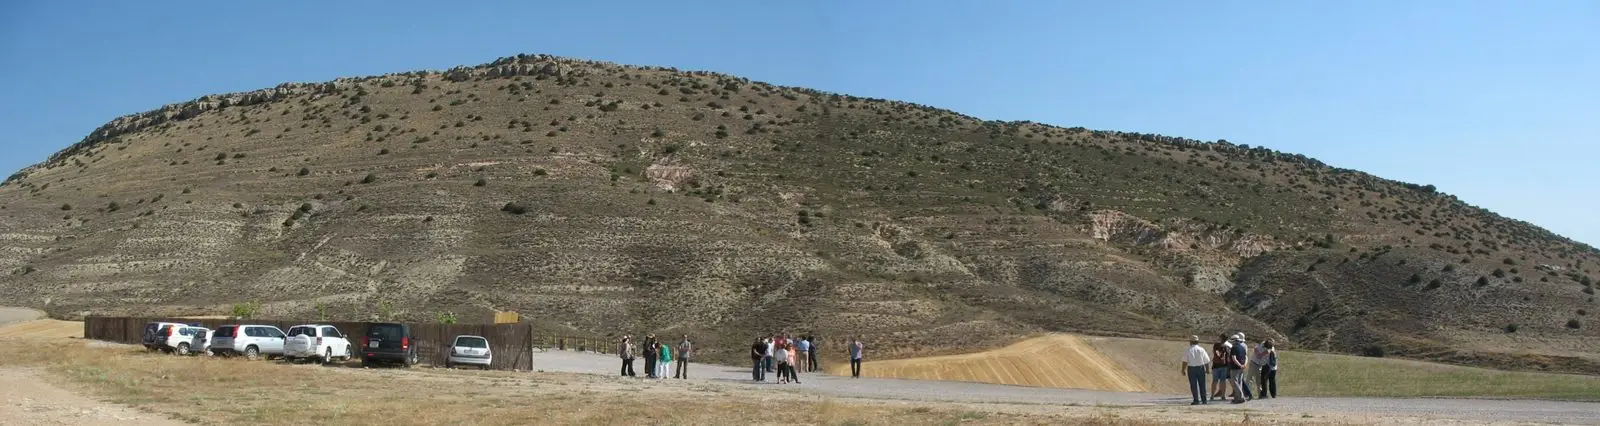
Fuentelsaz Stratotype: a global geological reference standard
FuentelsazPR-GU 12: the Fuentelsaz Kite and the Stratotype
13.9 km · Circular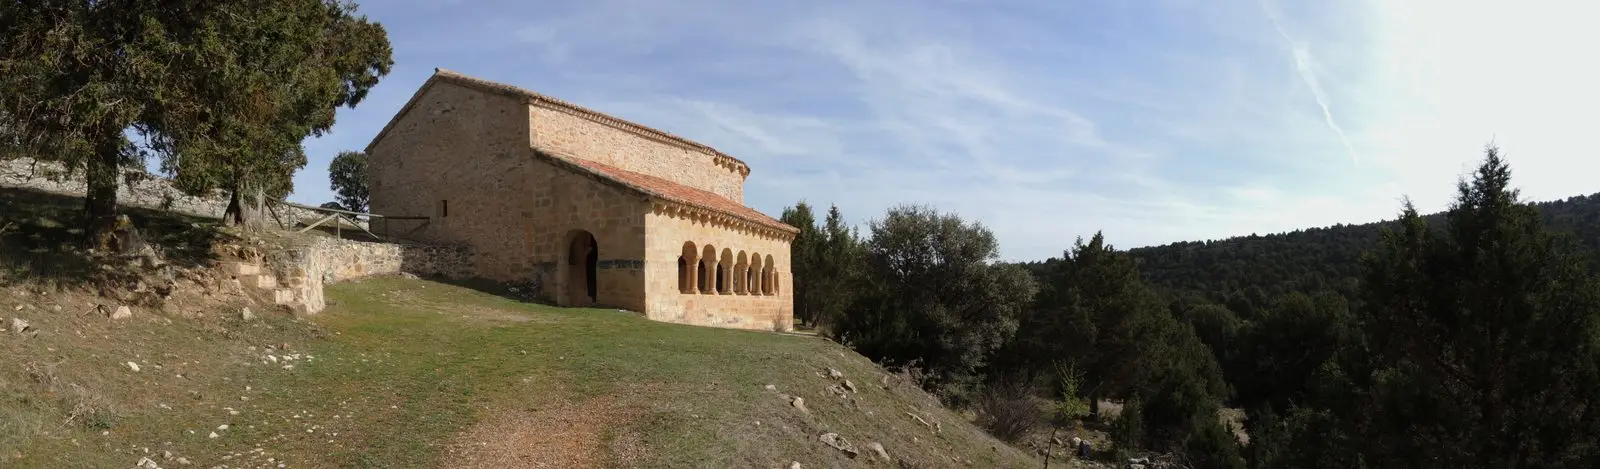
Hermitage of Santa Catalina of Hinojosa: Romanesque among junipers
HinojosaChurch of Santiago in Labros: a recovered Romanesque gem
LabrosChurch of Santo Domingo de Guzmán (Algar de Mesa)
Algar de MesaAmayas Elm: a survivor of Dutch elm disease
AmayasPozo Galeano (Villel de Mesa): gorge and waterfall of the Mesa River
Villel de Mesa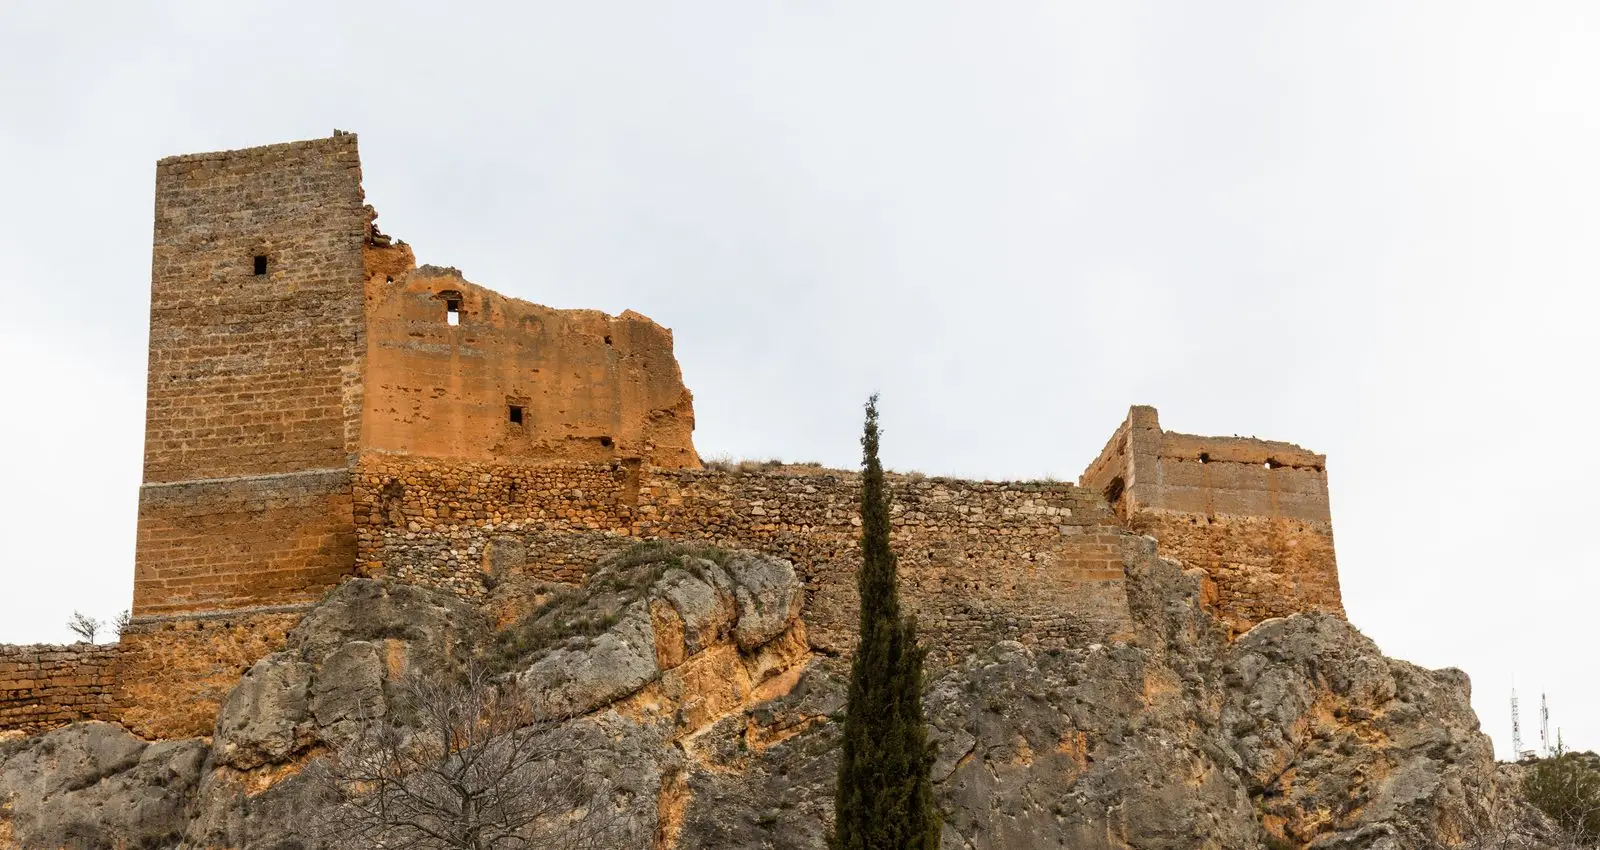
Castle of Villel de Mesa: the rock fortress of the Funes
Villel de MesaPopulation of Milmarcos, 1842–2021
Milmarcos reached a peak of 909 inhabitants in 1910 . In the 2021 census there were 73 , a decrease of 92%. This is the history told in the emptying of the Alto Tajo.
Climate in Milmarcos month by month
2015–2024 averages from Copernicus ERA5 reanalysis for an altitude of approx. 1,056 m. Useful for planning, not a substitute for live forecasts.
Location
● Reference point · ● Villages · ● Places
Location diagram. Detailed map with tracks and names loads on zoom.
Reference villages: Fuentelsaz · Hinojosa · Labros · Algar de Mesa.
Open the full map and historical layers →