Village · Guadalajara · 1,359 m
Chequilla
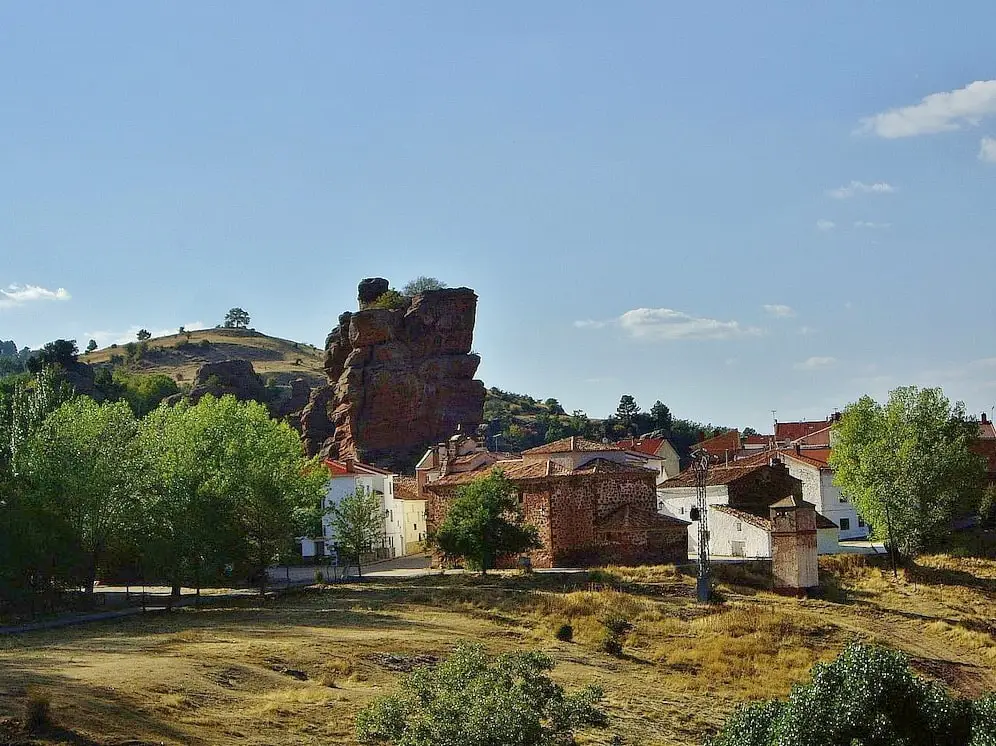
Chequilla is a village in the Alto Tajo at about 1,360 metres, whose whitewashed houses are built among towers and monoliths of red sandstone. It has a small enchanted city of rock, Las Quebradas, and a natural bullring framed by these sandstone formations, considered unique in Spain.
Rivers and basins
The thread of water from Chequilla
Follow these watercourses towards their confluences, villages, and basin history.
Lands and landscapes
From here, follow the memory of the territory
These readings connect Chequilla with the history, work, and villages around it.
Traces in the village and its surroundings
Which eras you can read here
A single place can preserve traces from different eras. These layers connect what you see with the stories in the atlas.
What to see in Chequilla
- Las Quebradas, a rock labyrinth at the entrance to the village.
- Plaza de toros, a natural arena set among sandstone monoliths.
- Mirador de la Vaqueriza, offering the clearest view over the village.
- Sima de las Grobias, for cavers.
Routes
The Sendero 15, Piedras Rojas de Chequilla, a walk of about 3 km for all ages, and Georuta 8 towards Checa.
Organizing your visit
Dedicate the visit to the village and surrounding rock formations. For a longer walk, check Sendero 15 before setting out.
Before travelling
The rock landscape is not universally accessible. Assess terrain, ice, and group mobility; the Sima de las Grobias is not a walking tour for general visitors.
Combining visits
Continue with Las Piedras Rojas de Chequilla. Check its guide to decide whether to combine it.
Places in and around Chequilla
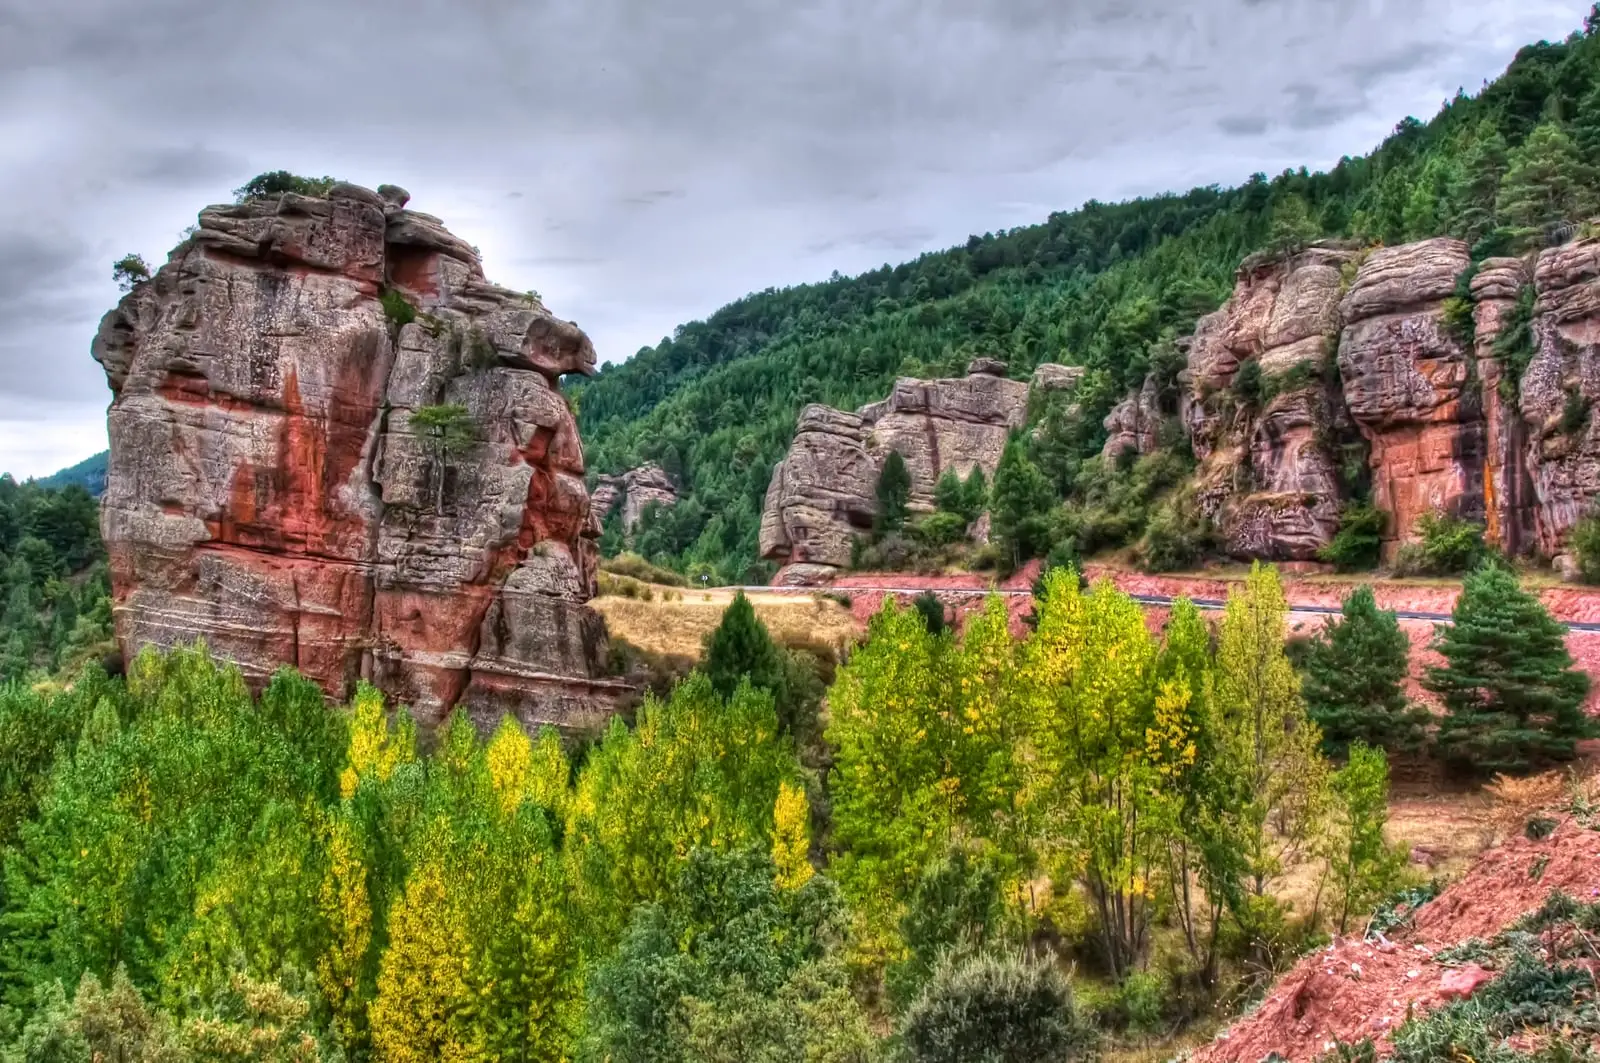
Las Quebradas: the little enchanted city of Chequilla
Chequilla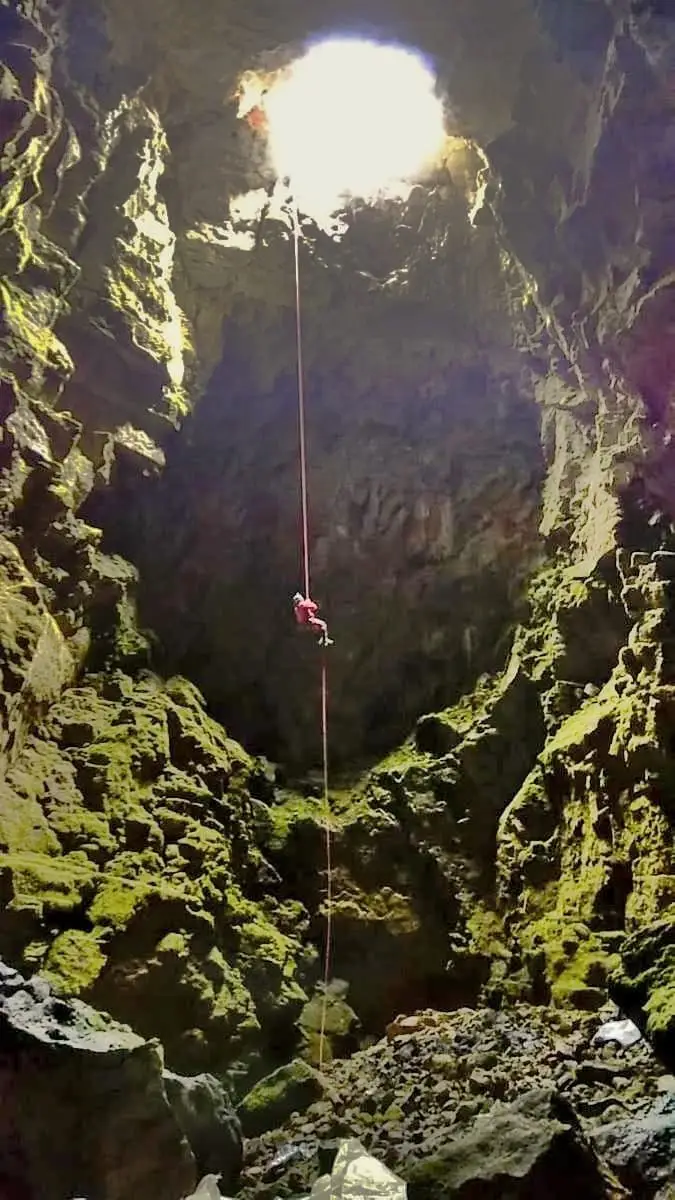
Grobias Chasm: A 45-Metre Open-Air Vertical Shaft
Chequilla, Peralejos de las Truchas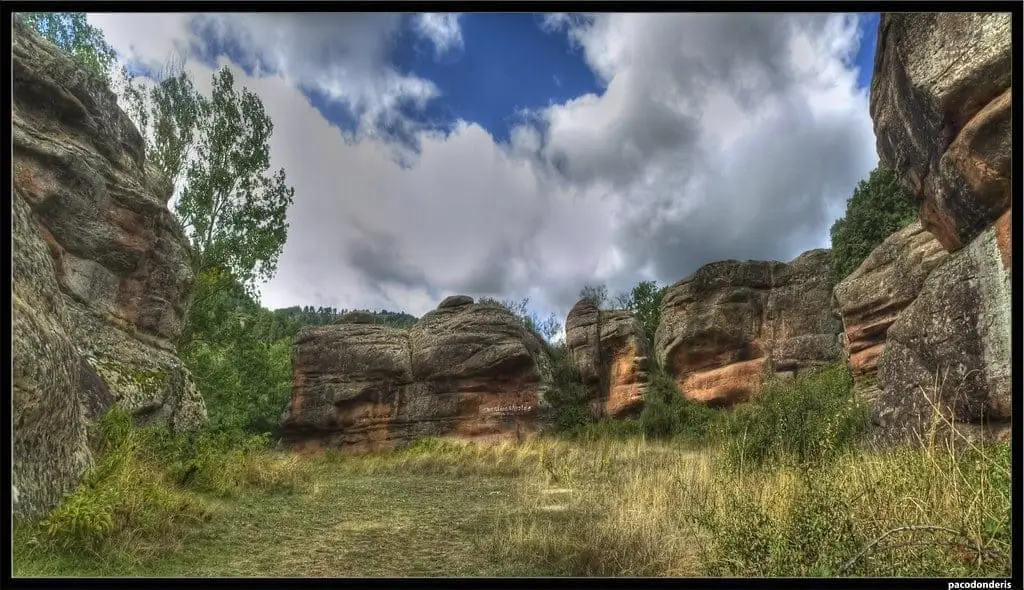
Chequilla bullring: an arena between stone towers
Chequilla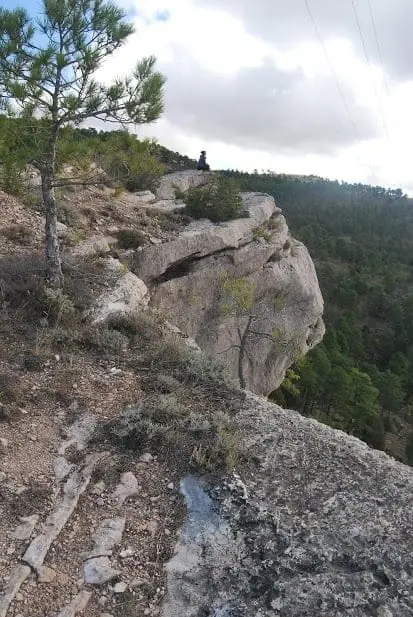
Mirador de la Vaqueriza: Chequilla and the Cabrillas valley
Chequilla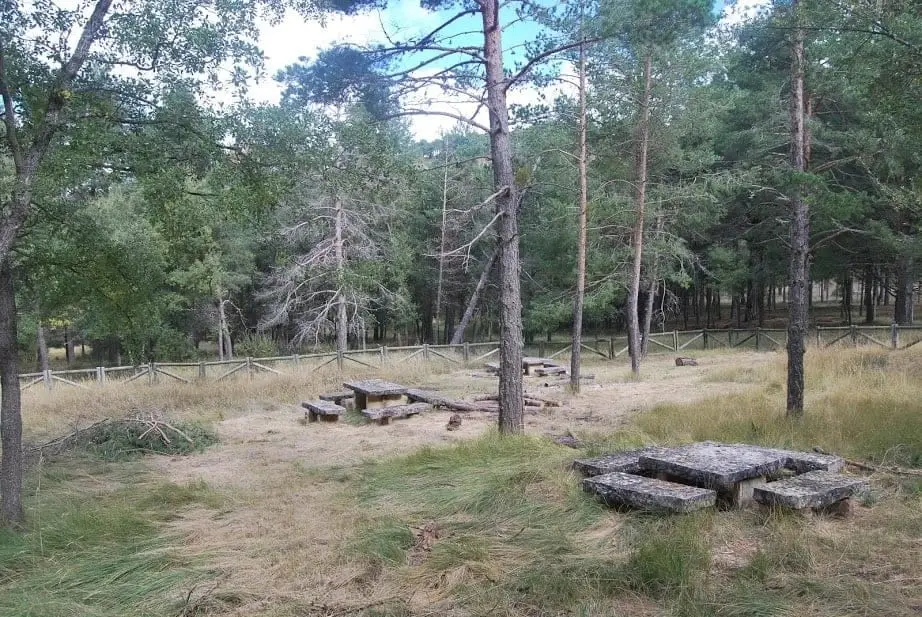
La Vaqueriza recreation area (Chequilla)
ChequillaRoutes linked to Chequilla
Near Chequilla
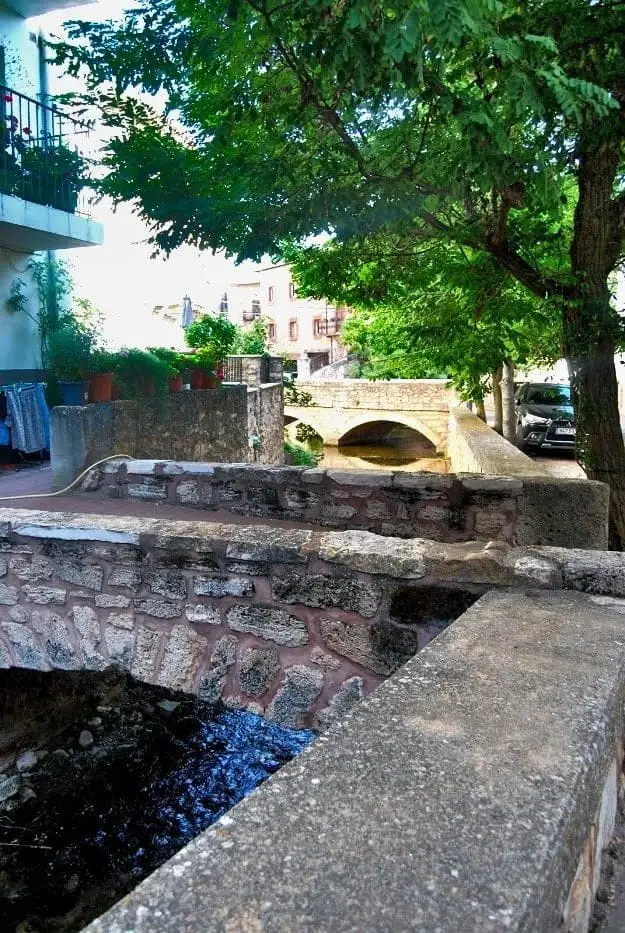
Urban ensemble of Checa: white houses, bridges, and the Genitoris River
Checa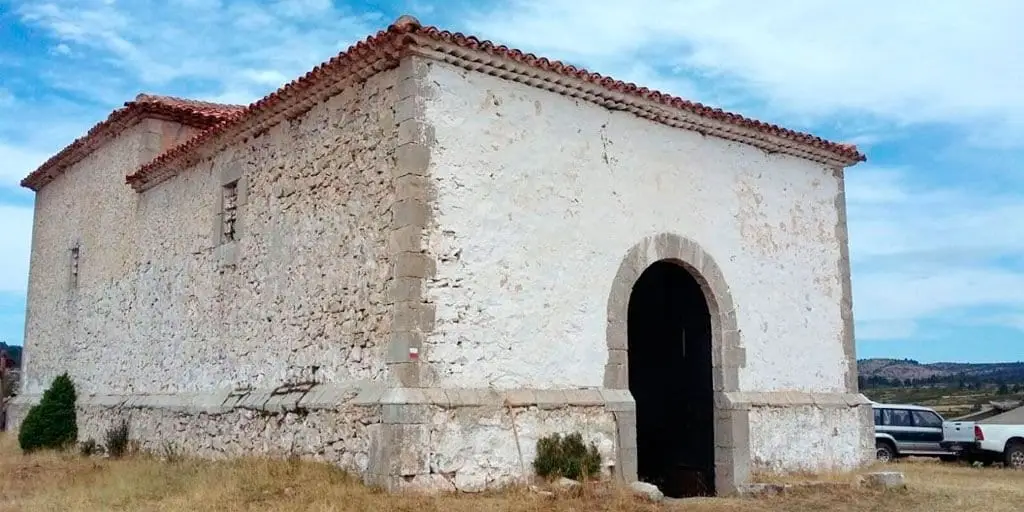
Hermitage of San Lorenzo (Checa): pilgrimage into Sierra Molina
Checa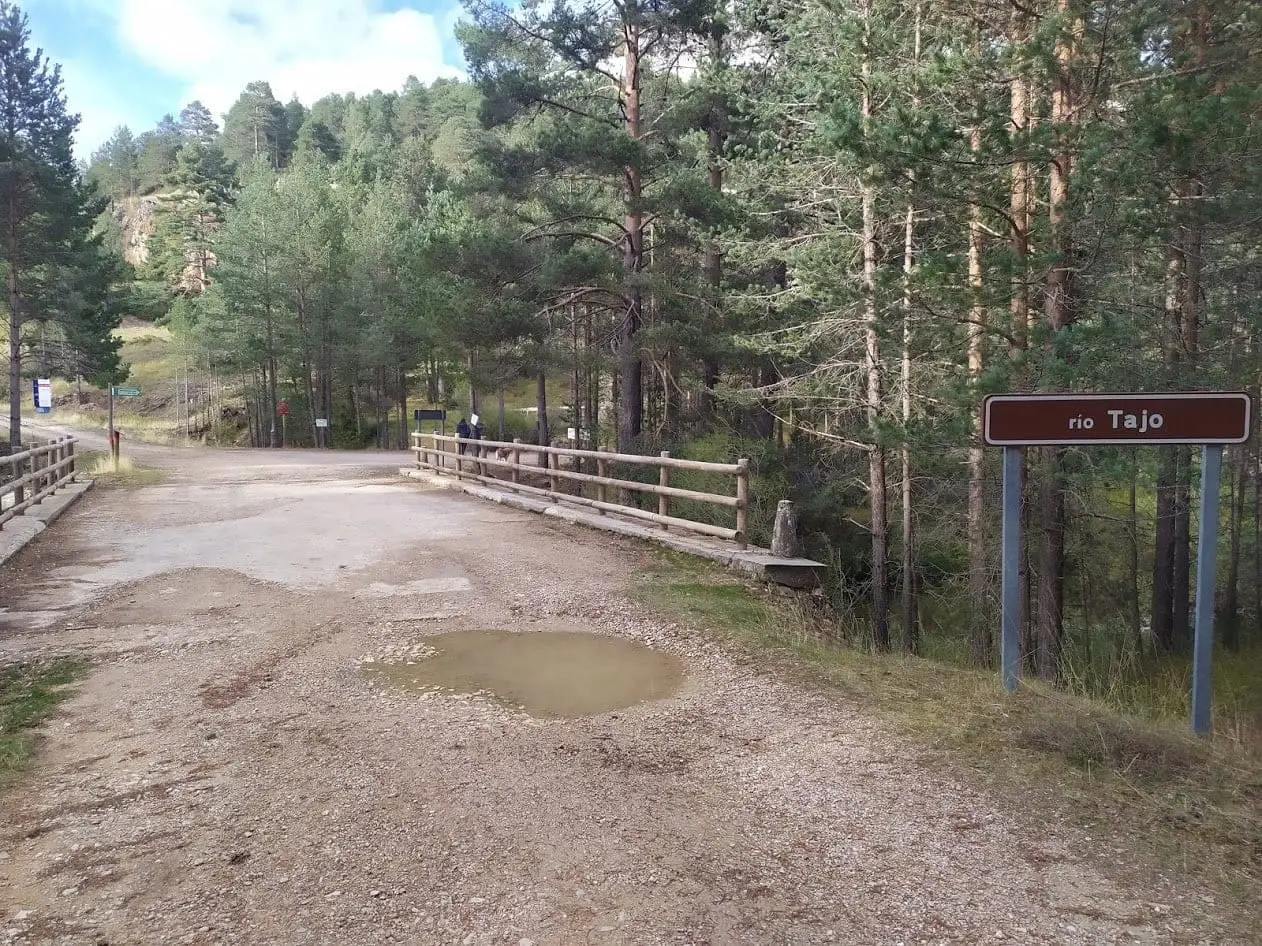
Puente de las Tres Provincias (Valdeminguete): where the Alto Tajo begins
ChecaCheca Graptolites: Fossils That Look Like Writing
ChecaPoljé del Cubillo (Checa): a closed karst valley
Checa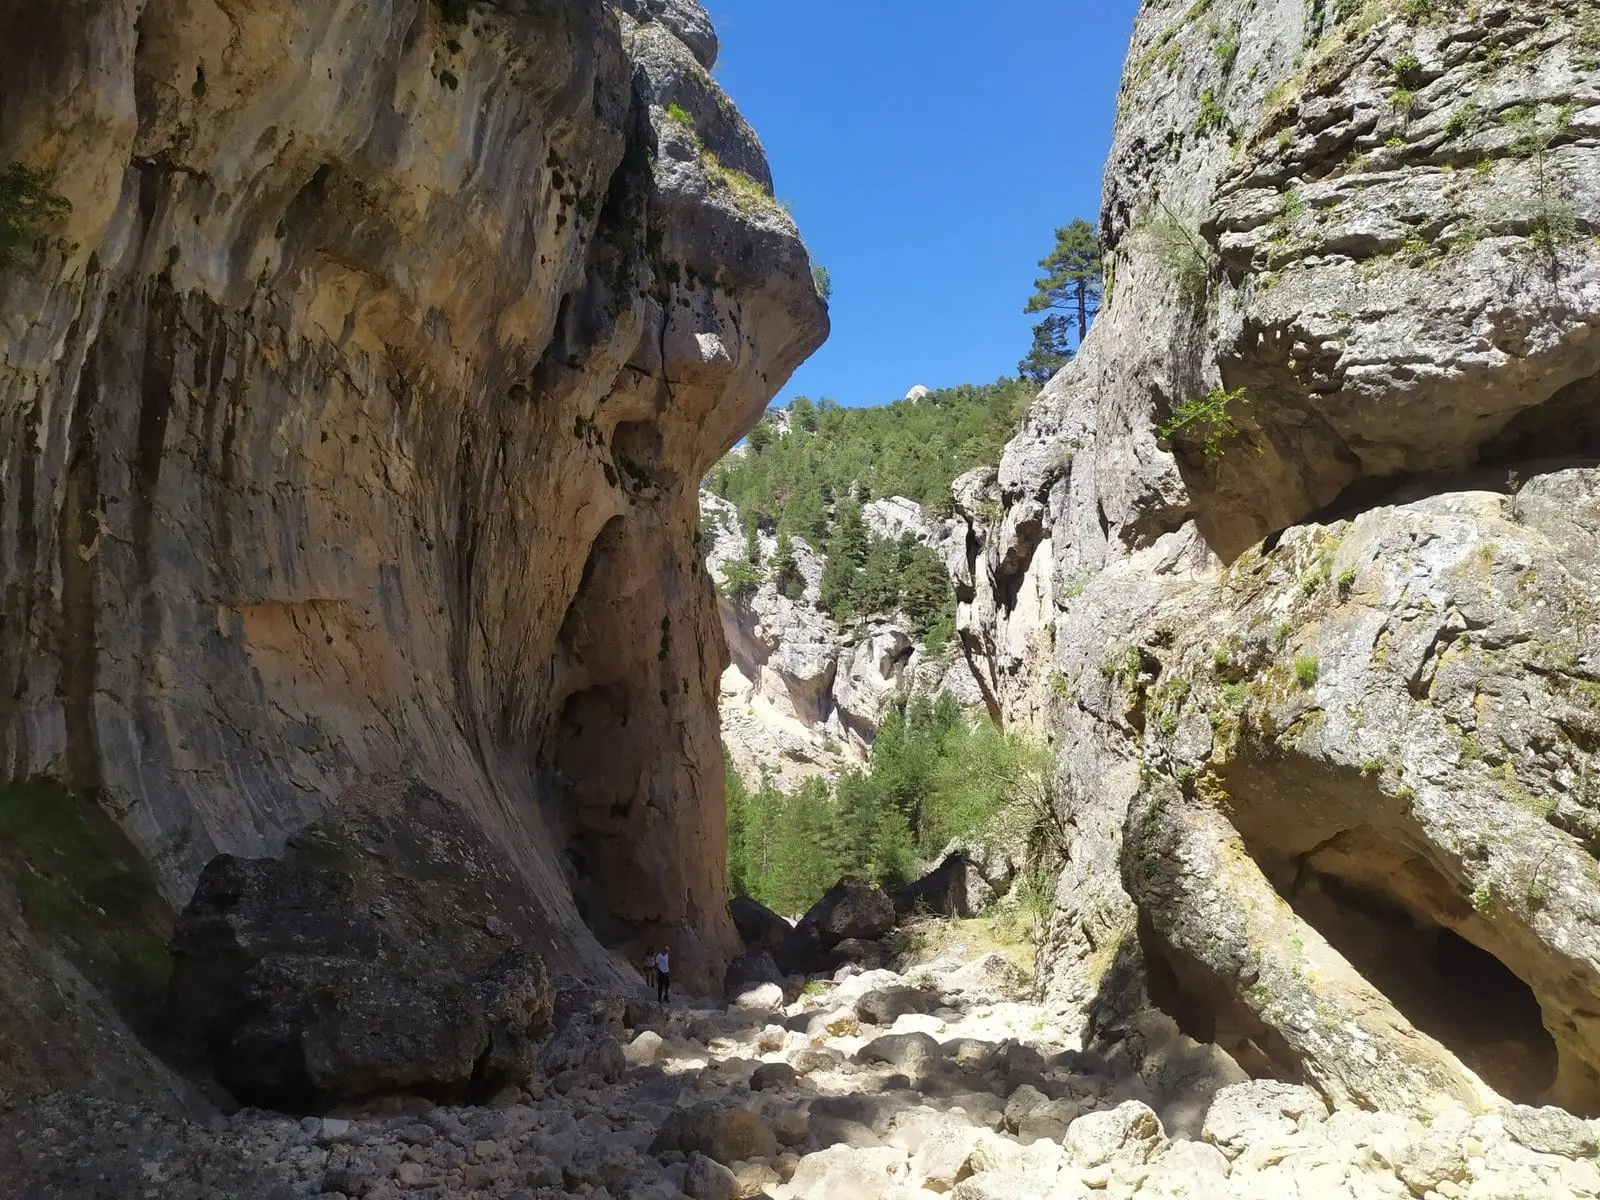
Rambla Malilla (Checa): the gorge running down to the Tajillo
ChecaPopulation of Chequilla, 1842–2021
Chequilla reached a peak of 203 inhabitants in 1910 . In the 2021 census there were 17 , a decrease of 92%. This is the history told in the emptying of the Alto Tajo.
Climate in Chequilla month by month
2015–2024 averages from Copernicus ERA5 reanalysis for an altitude of approx. 1,359 m. Useful for planning, not a substitute for live forecasts.
Location
● Reference point · ● Villages · ● Places
Location diagram. Detailed map with tracks and names loads on zoom.
Reference villages: Checa · Megina · Peralejos de las Truchas · Traíd.
Open the full map and historical layers →